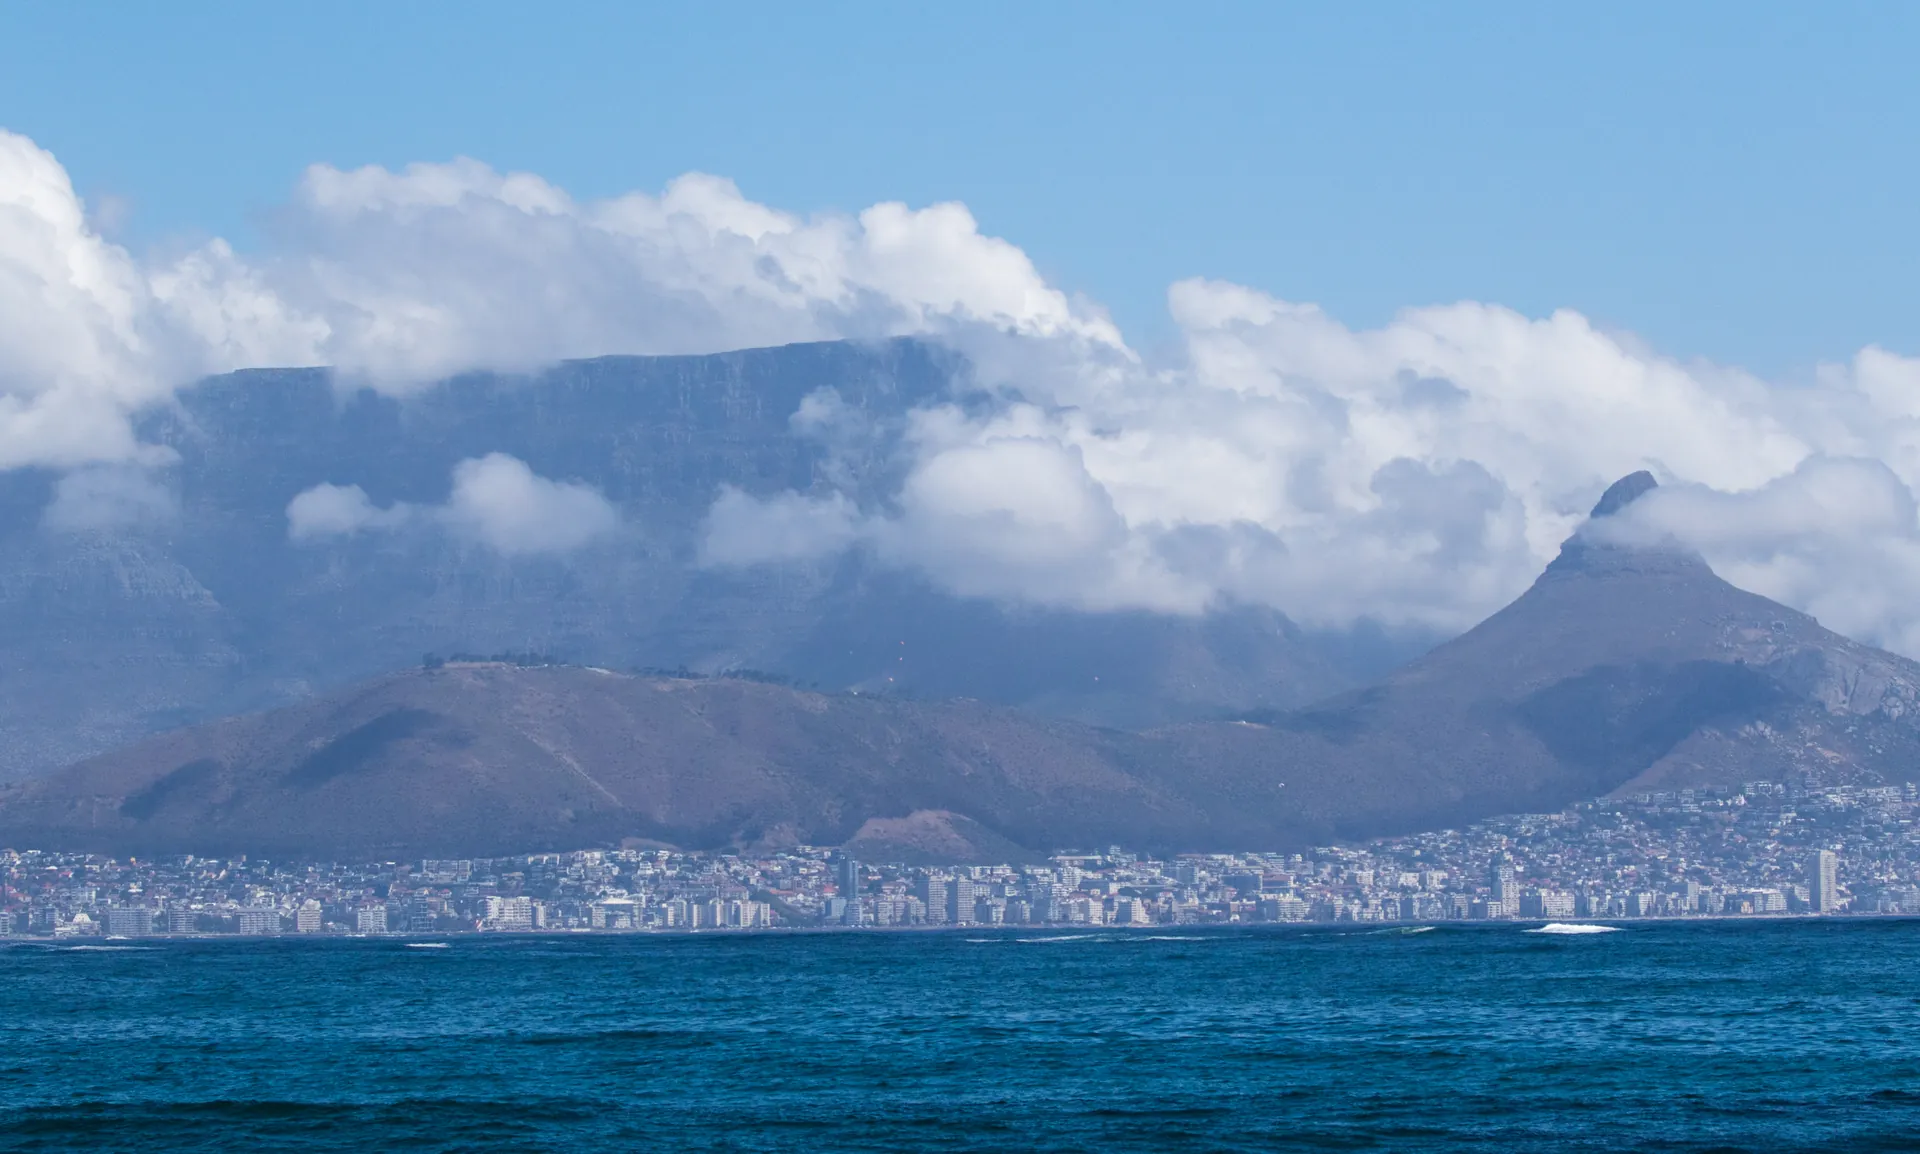
Robben Island Weather: ten years of wind data, measured when the ferries sail
 By Andrea Semonella
Updated on 10 min read
By Andrea Semonella
Updated on 10 min read
In short
Ten years of readings from the weather stations in Cape Town harbour and on Robben Island, 2015 to 2024, show that strong wind during ferry hours is mostly a summer problem. On 9.6% of January days, at least one reading at one end of the crossing reached 41 km/h or more; from June to August that happened on 1.3% of days or fewer. Wind also builds through the day, and the morning ferries usually cross in calmer conditions.
What ten years of wind data show
We collected every wind reading taken at 08:00, 11:00 and 14:00, the reports closest to the ferry departures, from two weather stations: one in the port of Cape Town, close to the Nelson Mandela Gateway where every ferry leaves, and one on Robben Island itself. That is 19,017 readings over ten years, from 2015 to 2024. Four findings stand out.
January is the windiest month for the ferry. On 9.6% of January days, roughly one in ten, at least one reading during ferry hours reached 41 km/h at the harbour or on the island. That is force 6 on the Beaufort scale, a strong breeze.
Strong wind is rarest in winter. Readings of 41 km/h or more made up 0.4% of the total in June and 0.6% in July, and in ten years of Augusts there was not a single one.
The wind picks up in the afternoon. From September to April, the average wind at 17:00, when the afternoon groups are still out, is 20.7 km/h, against 13.8 km/h at 08:00, and readings of 41 km/h or more are 2.5 times as frequent.
The south-easter blows harder at the harbour than on the island. In the hours when the harbour station measured 41 km/h or more, the island station averaged 30.0 km/h, and only 4.0% of those island readings also reached 41 km/h.
- 9.6%January days with a 41 km/h reading during ferry hours
- 0.0%August days with a 41 km/h reading, in ten years
- 3.2%Days in the year with a 41 km/h reading during ferry hours
- 19,017Wind readings analysed, 2015 to 2024
Robben Island wind, month by month
The chart shows, for each month, the share of days on which at least one reading at 08:00, 11:00 or 14:00 reached 41 km/h at the harbour or on the island. It is the simplest way we found to count strong-wind days at the hours when the ferries sail.
- January9.6%
- February4.3%
- March5.2%
- April2.7%
- May1.5%
- June0.9%
- July1.3%
- August0.0%
- September2.5%
- October2.8%
- November3.5%
- December5.0%
Share of days on which at least one reading at 08:00, 11:00 or 14:00 reached 41 km/h at Cape Town harbour or on Robben Island. 2,389 days with all readings at both stations, 2015 to 2024. Source: NOAA ISD. Our indicator, not museum data.
The table below adds the averages and a lower threshold, 31 km/h, force 5 or a fresh breeze, so you can check whether the result depends on where the line is drawn. It hardly does: with either threshold, the windiest stretch runs from December to March, and May to August are the calmest months. Over the whole year, 3.2% of days had a 41 km/h reading during ferry hours, and 11.4% had a reading of 31 km/h or more.
| Month | Average wind, harbour / island (km/h) | Readings of 31 km/h or more | Readings of 41 km/h or more | Days with a 41 km/h reading | Winds of 20 km/h or more mostly from |
|---|---|---|---|---|---|
| January | 14.3 / 13.3 | 15.0% | 4.8% | 9.6% | South-easter (S, SE), 84% |
| February | 12.9 / 12.2 | 11.4% | 1.8% | 4.3% | South-easter (S, SE), 81% |
| March | 11.9 / 11.8 | 11.1% | 1.6% | 5.2% | South-easter (S, SE), 80% |
| April | 10.4 / 11.4 | 9.4% | 1.6% | 2.7% | South-easter (S, SE), 75% |
| May | 6.9 / 9.7 | 2.7% | 0.8% | 1.5% | South-easter (S, SE), 67% |
| June | 8.0 / 11.8 | 3.1% | 0.4% | 0.9% | North-west (N, NW, W), 62% |
| July | 8.2 / 11.2 | 3.5% | 0.6% | 1.3% | North-west (N, NW, W), 58% |
| August | 8.5 / 10.7 | 3.6% | 0.0% | 0.0% | North-west (N, NW, W), 53% |
| September | 11.0 / 12.8 | 6.4% | 1.3% | 2.5% | South-easter (S, SE), 74% |
| October | 11.8 / 13.2 | 8.2% | 1.6% | 2.8% | South-easter (S, SE), 86% |
| November | 13.5 / 13.8 | 8.9% | 2.1% | 3.5% | South-easter (S, SE), 90% |
| December | 13.5 / 13.0 | 9.4% | 2.7% | 5.0% | South-easter (S, SE), 89% |
| Whole year | 10.9 / 12.1 | 7.6% | 1.6% | 3.2% | Varies by season |
Two things help in reading the table. The averages look low because they include every calm reading, so for a crossing the share of strong readings in the next columns says more. The island's average is also slightly higher than the harbour's, yet the harbour has many more strong readings, as the next section explains.
South-easter in summer, north-westerly fronts in winter
From September to May, most winds of 20 km/h or more during ferry hours come from the south and south-east, with a peak of 90.1% in November. This is the south-easter, the dry summer wind that Capetonians call the Cape Doctor. The harbour station records it mostly as a southerly, the island station as a south-easterly.
From June to August the pattern reverses. North-west, north and west winds make up 61.5% of the stronger winds in June and 58.3% in July. They arrive with the winter cold fronts that bring Cape Town its rain. During ferry hours, though, they produced far fewer readings of 41 km/h than the summer south-easter.
The two stations also differ. Over the year, the island has a slightly higher average, 12.1 km/h during ferry hours against 10.9 km/h at the harbour, but far fewer strong readings: 0.1% at 41 km/h or more, against 1.5% at the harbour. On a south-easter day, the wind you feel at the Waterfront is often stronger than what the island station records.
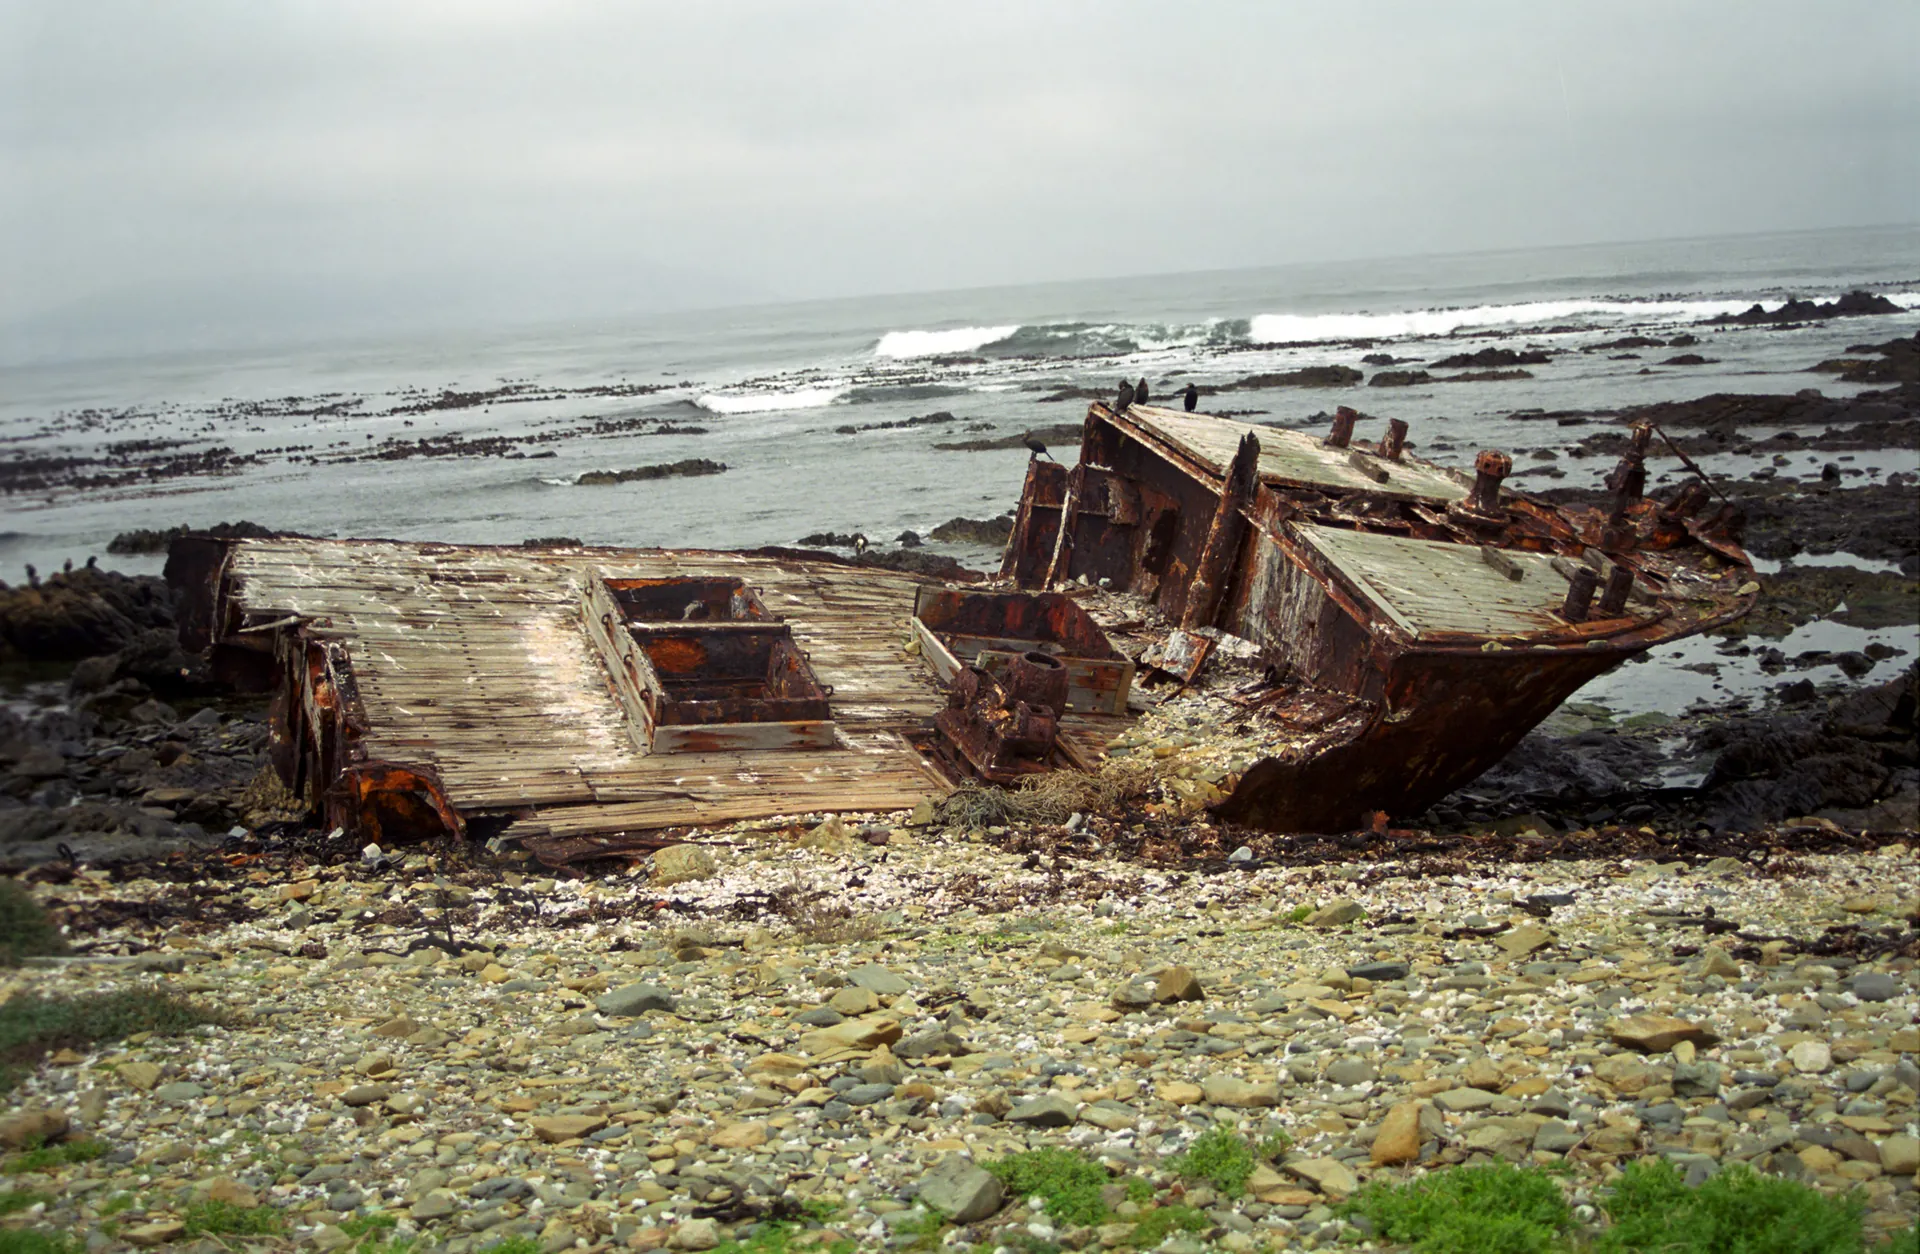
A rusted wreck on the rocky shore of Robben Island
Morning or afternoon ferry?
From September to April, when there are four departures a day, the wind is lightest in the morning and strongest in the late afternoon. The chart uses the stronger of the two stations at each hour.
- 08:0013.8 km/h
- 11:0015.2 km/h
- 14:0018.4 km/h
- 17:0020.7 km/h
Cape Town harbour and Robben Island, 2015 to 2024. Readings are 10-minute averages, not gusts. Source: NOAA ISD.
The share of readings at 41 km/h or more stays similar at 08:00, 11:00 and 14:00 (2.6%, 1.7% and 2.4%), then jumps to 6.5% at 17:00. At that hour the 13:00 group is sailing back, and the 15:00 group is on the island with the return crossing still ahead.
Cape Town International Airport, which reports every hour, shows the same rise at the exact departure times. From September to April, its readings of 41 km/h or more go from 2.1% at 09:00 to 13.1% at 15:00. The airport lies inland and is windier than the two stations on the bay, so its figures are higher, but the pattern through the day is the same.
From May to August the curve is almost flat: 11.4 km/h on average at 08:00, 13.6 km/h at 17:00. In winter the time of day matters much less.
On Robben Island, strong wind comes mainly in summer. Winter mornings are the calmest time to cross.
What it means for planning your visit
If a calm crossing matters most to you, go between May and August. Those months had the fewest strong-wind days during ferry hours, though there are three departures a day instead of four. The windiest months, December to March, fall in the busiest season: in that period, between 4.3% and 9.6% of days had a 41 km/h reading during ferry hours.
Whatever the season, and above all in summer, take the 09:00 or 11:00 ferry if you can. The morning boats cross in lighter wind and bring you back by mid-afternoon, and if your sailing is cancelled you still have the rest of the day to sort things out. The timetable by season is on our Robben Island ferry page. Keep the island for your first days in Cape Town and book the ferry and prison tour for early in the trip, so that a cancelled crossing still leaves time to try again.
If you want to keep the option of moving the date when the forecast looks bad, the flexible Ferry Ticket & Prison Museum Tour costs €65 instead of €42.50 and can be cancelled or moved for free up to 24 hours before, for any reason. The standard ticket is non-refundable and the date cannot be changed. Every option is compared on the Robben Island tickets page.
What this data cannot tell you
The Robben Island Museum does not publish how many sailings it cancels, or why. This page measures wind, not cancellations. The 41 km/h line is our indicator, chosen because it marks the start of a strong breeze, force 6 on the Beaufort scale as the Met Office describes it. It is not a rule used by the museum or by the ferry crews.
Wind is not the only factor. Swell can make the crossing rough on a day with little wind, and there is no wave data in this analysis. The readings are 10-minute averages, so gusts are stronger than the numbers here. Some tour sellers say winter brings more cancellations; if that is true, wind during ferry hours does not explain it on its own.
The figures on this page describe the past ten years. For the forecast for the coming days, departure by departure, see whether the Robben Island ferry is running today, where the same 41 km/h line is applied to the live forecast.
On the day, what counts is the museum's decision. According to its frequently asked questions, it can cancel or change sailings without notice and refunds official tickets when a sailing is cancelled for bad weather. If the forecast looks rough, call +27 21 413 4200 before you set off.
How we calculated this
Data
Weather reports from the Integrated Surface Database of NOAA's National Centers for Environmental Information, downloaded on 14 October 2026. The stations are Cape Town Portnet (WMO 68817), in the port of Cape Town, and Robben Island (WMO 68813), on the island. Both report every three hours.
Period and hours
1 January 2015 to 31 December 2024, converted to South African time (UTC+2). We used the reports at 08:00, 11:00 and 14:00, the ones that fall around the 09:00 to 15:00 departures: 10,290 readings at the harbour and 8,727 on the island. The island station has gaps, especially in 2020, with 383 readings. The indicators marked "harbour or island" use the 8,452 hours with a reading at both stations and take the stronger of the two; the day counts use the 2,389 days with all six readings. January, the windiest month, counts 198 such days, 19 of them with a 41 km/h reading.
Thresholds
The stations report wind in whole knots. We count 17 knots or more (31 km/h, force 5, fresh breeze) and 22 knots or more (41 km/h, force 6, strong breeze). Wind direction is counted for readings of 11 knots or more (20 km/h, force 4), grouped into eight compass sectors. Missing readings and readings flagged as suspect by NOAA's quality control were left out.
Checks
The seasonal pattern at the island matches the harbour and Cape Town International Airport: the monthly averages correlate at 0.86 with the harbour and 0.84 with the airport, whose hourly reports we used for the departure-time comparison.
Licence
NOAA data shared through its open data programme are open to the public and can be used as desired, with attribution. NOAA does not endorse this page. Every figure here comes from one Python script run on the raw NOAA files, and we can share it on request.
Citing this page
You can cite these figures with a link to this page: Robben Island Guide, "Robben Island weather: ten years of wind during ferry hours", robbenislandguide.com/robben-island-weather/.
Robben Island weather: FAQ
What is the weather like on Robben Island?
Breezy more often than not. Between 2015 and 2024 the average wind on the island during ferry hours was 12.1 km/h, a little more than at the harbour (10.9 km/h), but strong readings of 41 km/h or more were rarer on the island. Bring a windproof layer whatever the season.
What is the best time to visit Robben Island for a calm crossing?
Judging by wind alone, May to August: in those months no more than 1.5% of days had a reading of 41 km/h or more during ferry hours. In every month the morning ferries cross in lighter wind than the afternoon ones. Our data covers wind, not swell, so a calm sea is never guaranteed.
What is the windiest month for the Robben Island ferry?
January. On 9.6% of January days, roughly one in ten, at least one reading at 08:00, 11:00 or 14:00 reached 41 km/h at the harbour or on the island. March, December and February follow.
Is the Robben Island ferry cancelled because of wind?
It can be. The museum cancels or changes sailings in strong wind or heavy swell, without notice, and refunds official tickets when it does. It does not publish how many sailings it cancels, so nobody outside the museum can give you a cancellation rate. If you want to be free to move your date, the flexible ticket on Tiqets can be cancelled or changed for free up to 24 hours before.
Is the morning or the afternoon ferry better?
The morning. From September to April the average wind is 13.8 km/h at 08:00 and 20.7 km/h at 17:00, when the afternoon groups are still out. A morning ferry also leaves you the rest of the day if your sailing is cancelled.
What is the Cape Doctor?
The local name for the south-easter, the strong, dry wind of the Cape summer. In our data it accounts for most of the wind during ferry hours from September to May: in November, 90.1% of the readings of 20 km/h or more came from the south or south-east.
How do I know if the ferry is running today?
Call the museum on +27 21 413 4200 before you leave for the V&A Waterfront. For the forecast, our page Is the Robben Island ferry running today? rates every departure of today and the next six days on wind and swell.
Andrea SemonellaBorn and raised in Genoa, Italy. Co-founder of Benicool, which publishes independent guides to cultural sites. He has travelled to every continent and writes about how to visit them without wasting time or money.
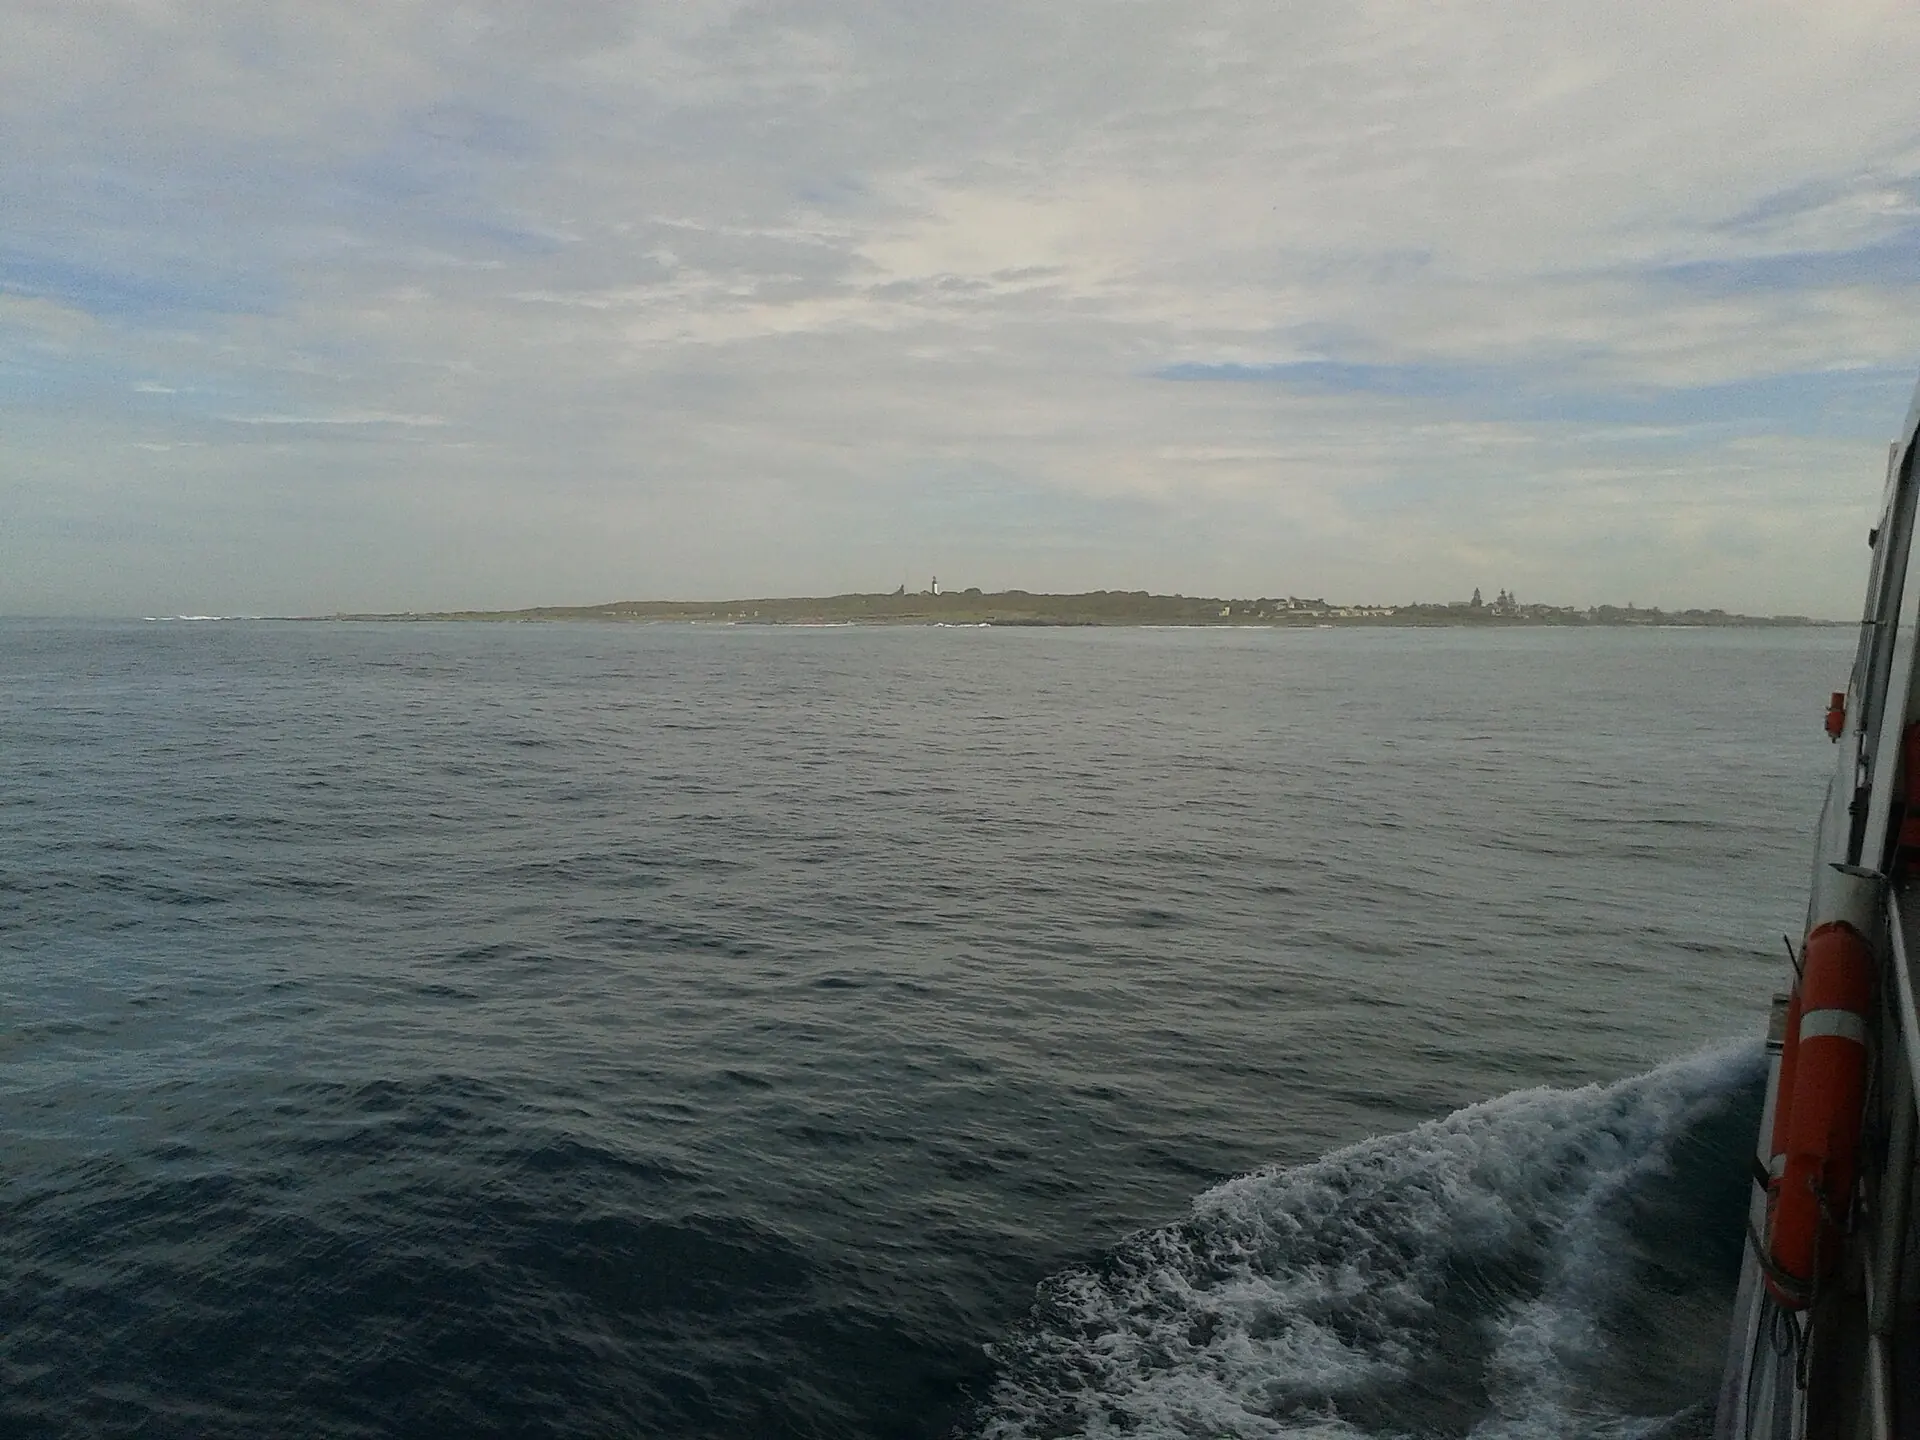 Robben Island ferry
 Robben Island tickets
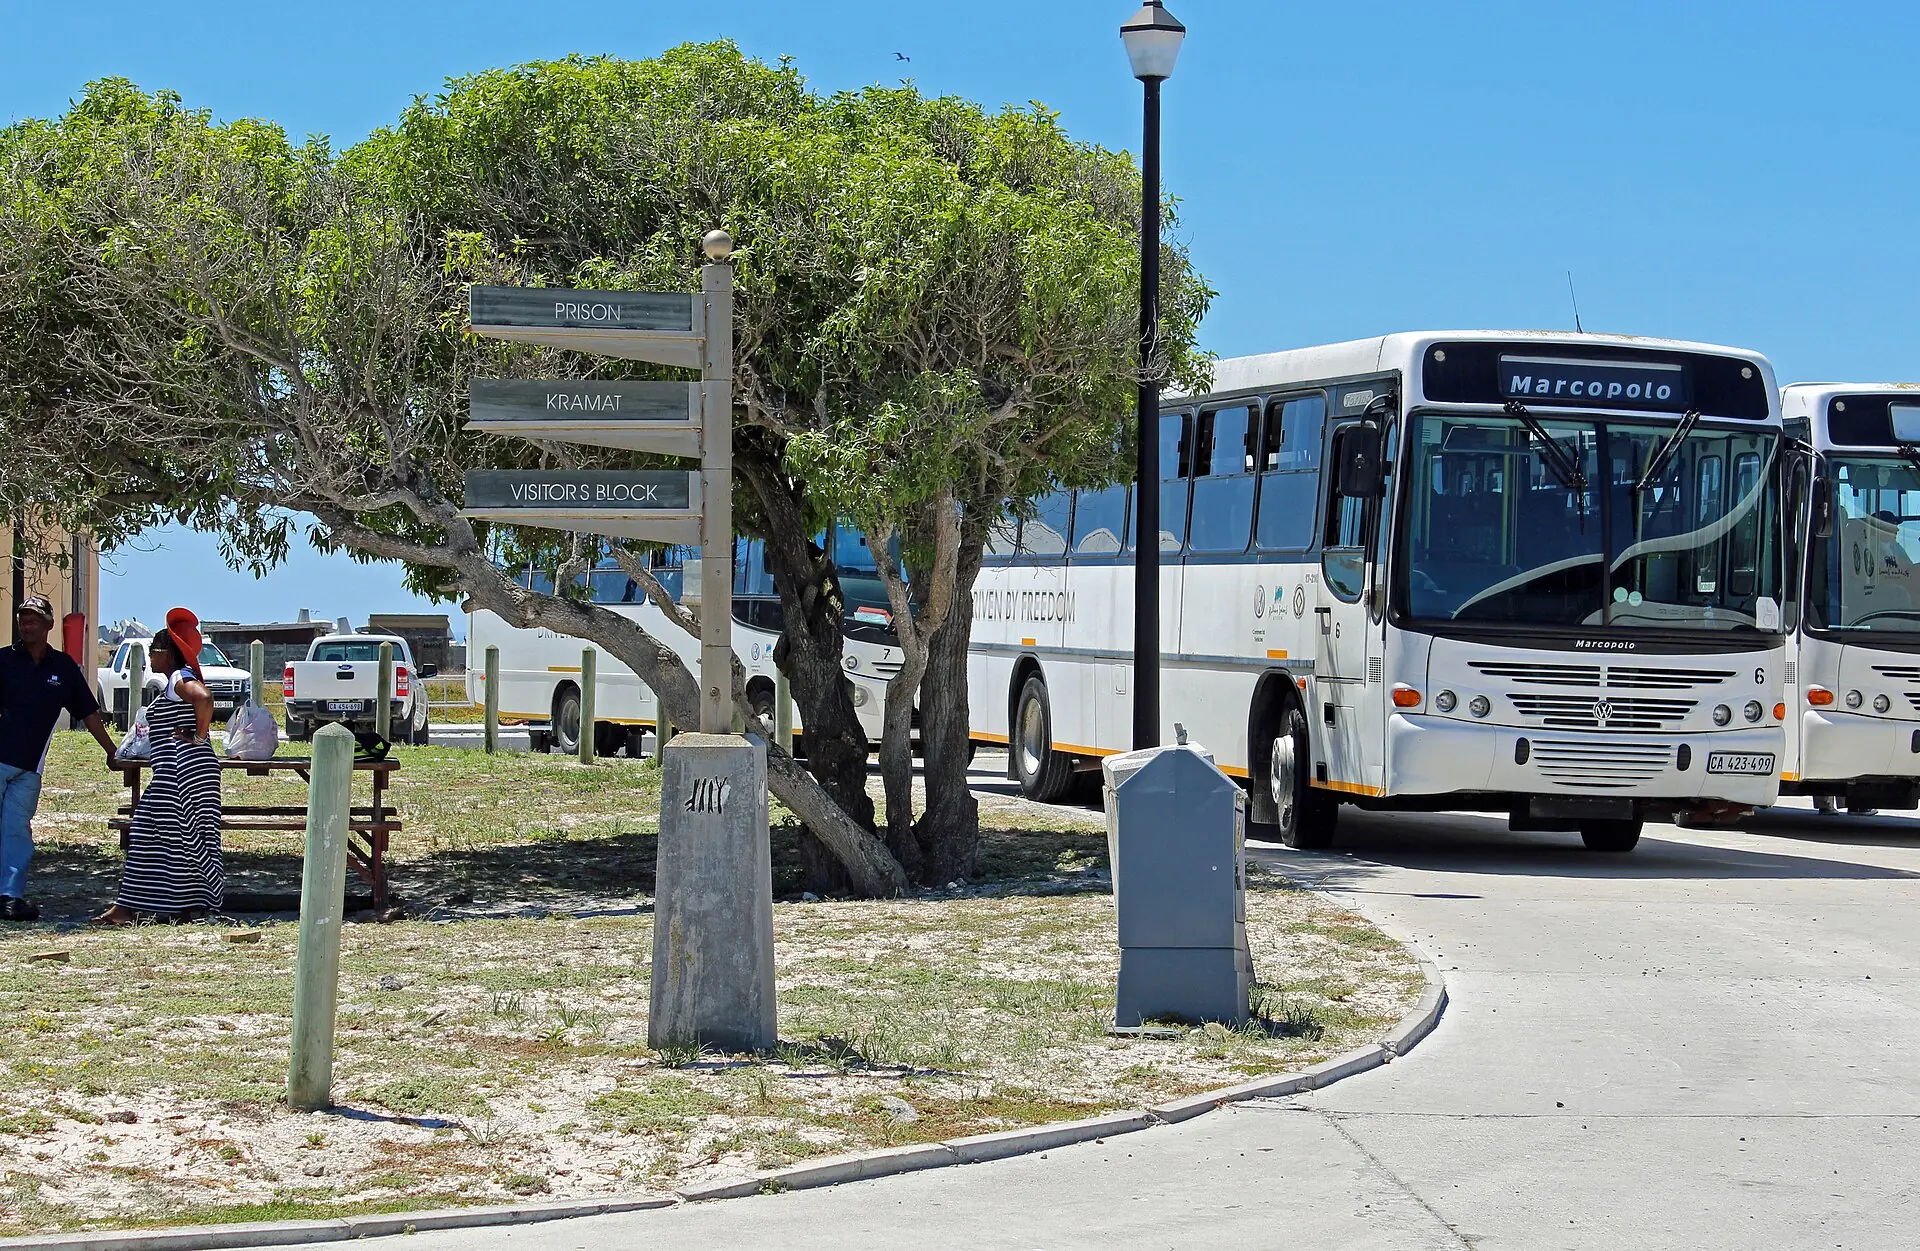 The Robben Island tour